
In this tutorial we are going to learn how to instrument Java code to expose application metrics using JMX monitoring. Following the code examples, you can monitor the availability, health and performance of your Java application. Java 1.5 introduced JMX – Java Management eXtensions – which is a standard way to instrument code in the JRE world. It allows you to export standard metrics and custom metrics using MBeans to a monitoring system, and understand how your application is performing (memory usage, cpu usage, number of threads, API calls in a REST endpoint… anything you want to instrument, really). Instrument #Java using #JMX monitoring and MBeans. Click to tweet This blog explains how JMX monitoring works and how to implement JMX metrics in your Java application.
JMX monitoring: What is Java JMX?
Large-scale Java applications bring with them various metrics needs. Whether you want to ensure all is working as it should, gather performance information, or understand usage patterns such as number of users connected, which endpoints are the most used ones in a REST API, etc. For large applications that, for instance, read or write from a database many times per second, it’s good practice to provide a monitoring interface like Java Management Extensions instead of logging output messages. Custom Java metrics are easier to maintain, troubleshoot and integrate with external monitoring tools. Any class that exports data to JMX is called a Managed Bean (MBean). These MBeans publish (export) their metrics to a MBean Server provided by the Java platform. The MBeanServer can be assimilated to a metric collection agent that scrapes the configured endpoints (MBeans) and publishes the metrics using different protocols like Java RMI or HTTP/SOAP. This would be a basic representation of the JMX monitoring/MBean architecture: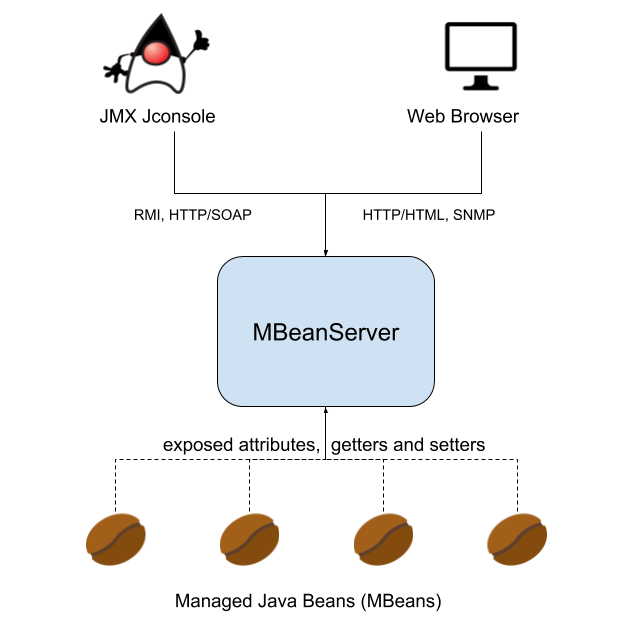
What is a Java MBean?
MBeans are just objects with methods that return information and are able to export this information via the MBeanServer to the outside world. There are four types of MBeans:Standard MBean:
This is the most common and easiest way to instrument an application. They retrieve the current value of the metrics, and allow you to modify them. Standard MBeans also implement some operations that can be invoked from outside the program during its execution. Use this one if you don’t need any extra behaviour, the only thing you need to do is create an interface with getter functions that export the information you want.Dynamic MBean:
This kind of MBean also implements getters and setters to retrieve or modify the metric that can be auto discovered by implementing the javax.management.DynamicMBean interface. These are useful when we have a class that doesn’t follow the MBean standard to publish the metrics. We can manually define how the MBeanServer must publish the values inside this class. Use this one if you don’t want to code an interface, or you don’t know beforehand what fields you need to export.Model MBean:
This is a generic, dynamic and configurable in runtime type of MBean used to instrument the resources. It allows any manager connected to the Java Dynamic Management agent to create and configure the MBean dynamically. Use this one if you need to give anyone who connects to the JMX freedom to instantiate and configure the MBean programmatically.Open MBean:
These are a type of Dynamic MBean and thus they must implement the javax.management.DynamicMBean interface. This type allows us to instrument objects that are discovered in runtime using only a predefined set of Java classes:- java.lang.Boolean
- java.lang.Byte
- java.lang.Character
- java.lang.Short
- java.lang.Integer
- java.lang.Long
- java.lang.Float
- java.lang.Double
- java.lang.String
- java.math.BigInteger
- java.math.BigDecimal
- javax.management.ObjectName
- javax.management.openmbean.CompositeData
- javax.management.openmbean.TabularData
Java JMX monitoring, code example
To understand how this is implemented, we will create a small example application that makes use of a Standard MBean. First, we need to create an interface that the MBeanServer will retrieve information from:public interface SystemStatusMBean {
Integer getNumberOfSecondsRunning();
String getProgramName();
Long getNumberOfUnixSecondsRunning();
Boolean getSwitchStatus();
}
- NumberOfSecondsRunning
- ProgramName
- NumberOfUnixSecondsRunning
- SwitchStatus
    File: jmx-example.java
    ----------------------

    public class SystemStatus implements SystemStatusMBean {
       private Integer numberOfSecondsRunning;
       private String programName;
       private Long numberOfUnixSecondsRunning;
       private Boolean switchStatus;
       private Thread backgroundThread;

       public SystemStatus(String programName) {
           // First we initialize all the metrics
           this.backgroundThread = new Thread();
           this.programName = programName;
           this.numberOfSecondsRunning = 0;
           this.numberOfUnixSecondsRunning = System.currentTimeMillis() / 1000L;
           this.switchStatus = false;

           // We will use a background thread to update the metrics
           this.backgroundThread = new Thread(() -> {
               try {
                   while (true) {
                       // Every second we update the metrics
                       numberOfSecondsRunning += 1;
                       numberOfUnixSecondsRunning += 1;
                       switchStatus = !switchStatus;
                       Thread.sleep(1000L);
                   }
               } catch (Exception e) {
                   e.printStackTrace();
               }
           });
           this.backgroundThread.setName("backgroundThread");
           this.backgroundThread.start();
       }


       // Through this getters, defined in the interface SystemStatusMBean,
       // all the metrics will be automatically retrieved

       @Override
       public Integer getNumberOfSecondsRunning() {
           return numberOfSecondsRunning;
       }

       @Override
       public String getProgramName() {
           return programName;
       }

       @Override
       public Long getNumberOfUnixSecondsRunning() {
           return numberOfUnixSecondsRunning;
       }

       @Override
       public Boolean getSwitchStatus() {
           return switchStatus;
       }
    }
File: jxm-mbean.java
--------------------

import javax.management.*;
import java.lang.management.ManagementFactory;

public class Main {
   public static void main(String[] args) {
       try {
           String programName = (args.length == 0) ? "Java" : args[0];

           // Initialize the object
           SystemStatus systemStatus = new SystemStatus(programName);

           // Register the object in the MBeanServer
           MBeanServer platformMBeanServer = ManagementFactory.getPlatformMBeanServer();
           ObjectName objectName = new ObjectName("com.sysdig.app:name=SystemStatusExample");
           platformMBeanServer.registerMBean(systemStatus, objectName);

       } catch (Exception e) {
           e.printStackTrace();
       }
   }
}
com.sysdig.app and the key would be name=SystemStatusExample.
Try it in Docker
Maybe you don’t have a Java compiler and runtime available in your local environment, no problem, you can always use Docker:$ docker run -d --rm --name jmx -p 5000:5000 sysdiglabs/jmx-metrics:0.1
jconsole and connecting to the local process:
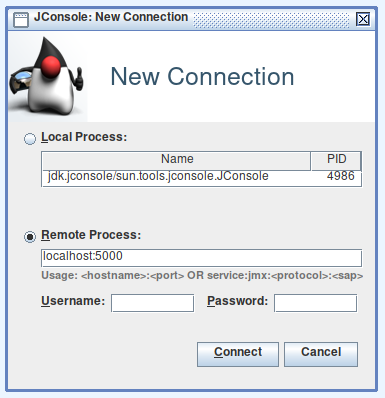 You will receive a security warning (no-SSL endpoint), it is safe to continue in this case.
Now go to the
You will receive a security warning (no-SSL endpoint), it is safe to continue in this case.
Now go to the MBeans tab, and using the left panel navigate to com.sysdig.app, SystemStatusExample, Attributes:
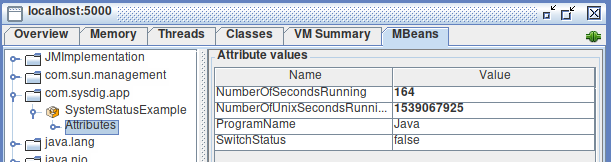 You should be able to see the custom JMX metrics we created and refresh their values live.
As you can see using the jconsole interface, there are several default metrics that you can monitor right away without any extra instrumentation, there is an appendix in this document if you want to learn more about these default MBeans.
You should be able to see the custom JMX metrics we created and refresh their values live.
As you can see using the jconsole interface, there are several default metrics that you can monitor right away without any extra instrumentation, there is an appendix in this document if you want to learn more about these default MBeans.
Java JMX monitoring with Sysdig Monitor
It’s likely you’ll want your monitoring system to display the JMX metrics, together with your JRE and other monitoring systems like Prometheus or StatsD. This can become more complex once you start running your Java applications inside containers and maybe also on top of Kubernetes. These are some of the obstacles you could run into when instrumenting Java code with JMX metrics:- You need to expose the JMX port, modify your Dockerfile, and maybe update you Kubernetes deployment definition.
- You have multiple pods moving around your Kubernetes nodes and exposing these metrics, how do you know the IP/port for your Java app?
- If you want to expose the metrics port, you need to implement some security like authentication, TLS.
- You can automatically discover the different components of your microservices applications, visualize how they interact with each other, and understand how the application works from a high level.
- No further code changes required. Sysdig Monitor will give you all the metrics you need right out of the box, including resource usage metrics per host and container as well as Golden Signal to monitor service health and performance—including connections, response time, and errors.
- Collect JMX monitoring metrics in one place, automatically! The Sysdig agent will dynamically enter in the process namespace of your running container and collect the MBeans metrics from a port binded to the localhost interface. You don’t need to expose the JMX port or modify any Dockerfiles or Kubernetes manifests. With Sysdig Monitor, JMX metric collection is damn simple and secure.
jmx:
  per_process_beans:
    systemStatus:
    pattern: "Main"
    beans:
        - query: "com.sysdig.app:name=SystemStatusExample"
          attributes:
            - name: NumberOfSecondsRunning
            alias: java.app.numberOfSecondsRunning
            - name: NumberOfUnixSecondsRunning
            alias: java.app.numberOfUnixSecondsRunning
            - name: SwitchStatus
            alias: java.app.switchStatus
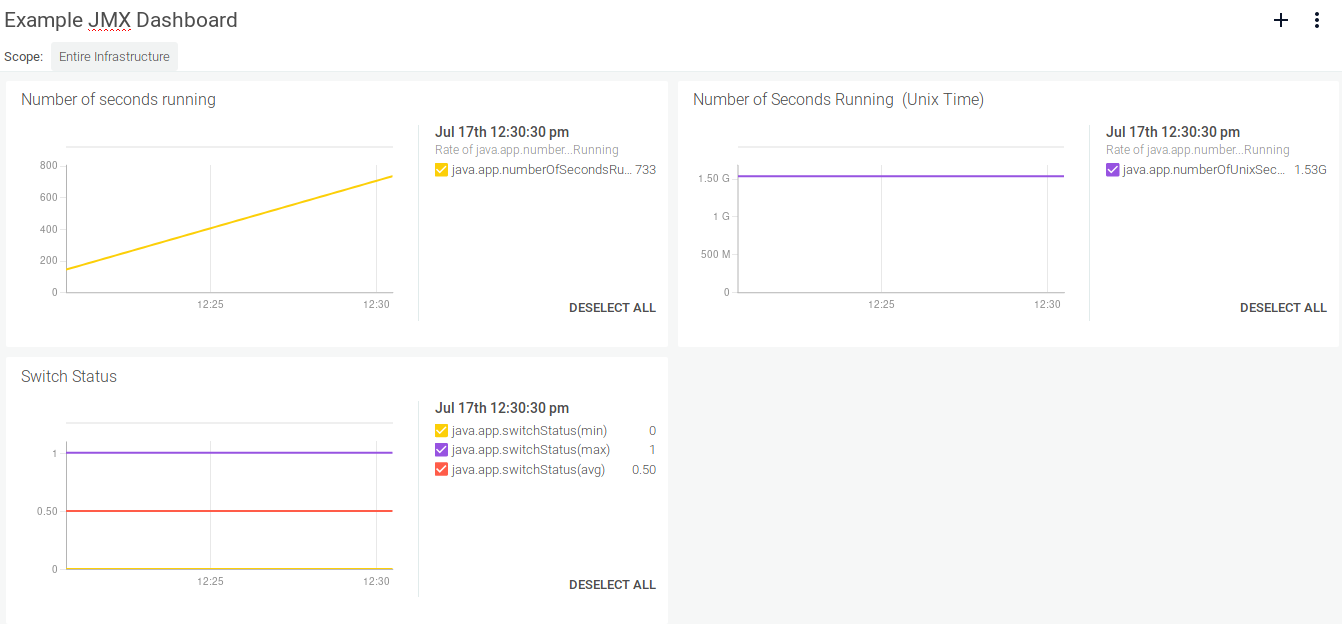
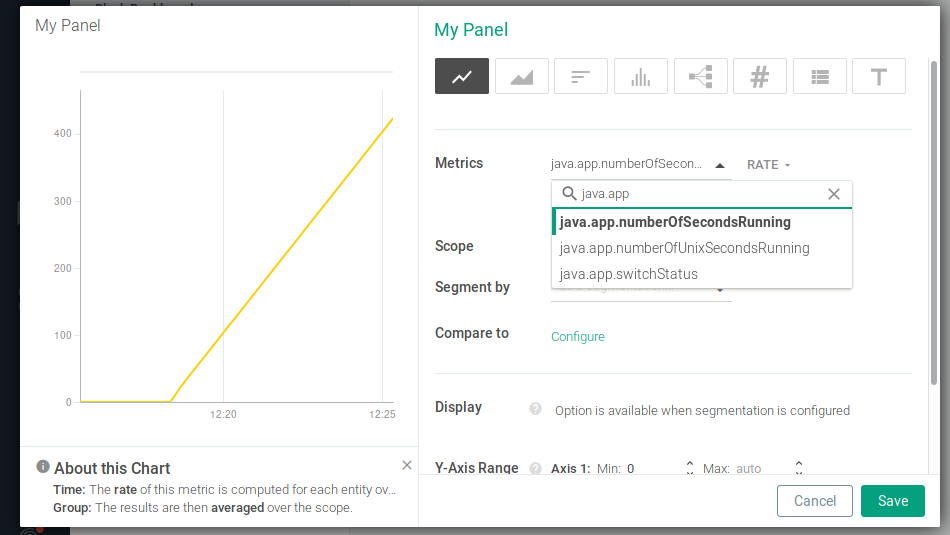 Or organize them in a nice dashboard:
Conclusions
Using Java Monitoring Extensions, you can easily add profiling and application-level monitoring to any of your Java applications. You’re also equipped with a set of generic JMX metrics to troubleshoot cpu load, memory usage, class loading and threads. Want to import JMX metrics from your Java apps but also have other metrics sources like Prometheus or statsd? Sysdig Monitor supports scraping JMX metrics, so you can unify all your metrics and generate dashboards and alerts from a single platform. Using Sysdig’s JMX query language you can automatically scrape any new Java processes and metrics that spawn on your environment (for example if you are using service autoscaling with Docker or Kubernetes).Appendix: Monitoring JMX default MBeans
Class properties exported through MBeans are called attributes, and methods exported through MBeans are called operations. There is a collection of MBeans and attributes which are already provided by the Java platform out of the box. Let’s take a look at the performance and troubleshooting information that we can collect from those classes before creating our own metrics:LoadedClassCount
MBean: java.lang:type=ClassLoading This is the number of classes that are currently loaded in the JVM. If this count keeps increasing you may have a problem with multiple classloaders loading the same classes at different times.TotalLoadedClassCount
MBean: java.lang:type=ClassLoading This is the number of classes that have been loaded since the JVM was started.UnloadedClassCount
MBean: java.lang:type=ClassLoading Classes are unloaded when the Classloader that loaded them is garbage-collected. This is the number of classes that have been unloaded from the JVM since it was started.TotalCompilationTime
MBean: java.lang:type=Compilation TotalCompilationTime is the accumulated time in milliseconds spent in JIT compilation. It can be used to monitor JIT performance in your scenario.Garbage Collector – CollectionCount
MBean: java.lang:type=GarbageCollector,name=[your GC name] This is the number of garbage collection events fired since the JVM was launched.Garbage Collector – CollectionTime
MBean: java.lang:type=GarbageCollector,name=[your GC name] CollectionTime is the total time spent doing garbage collection in milliseconds and is another good candidate to profile your Java application behaviour.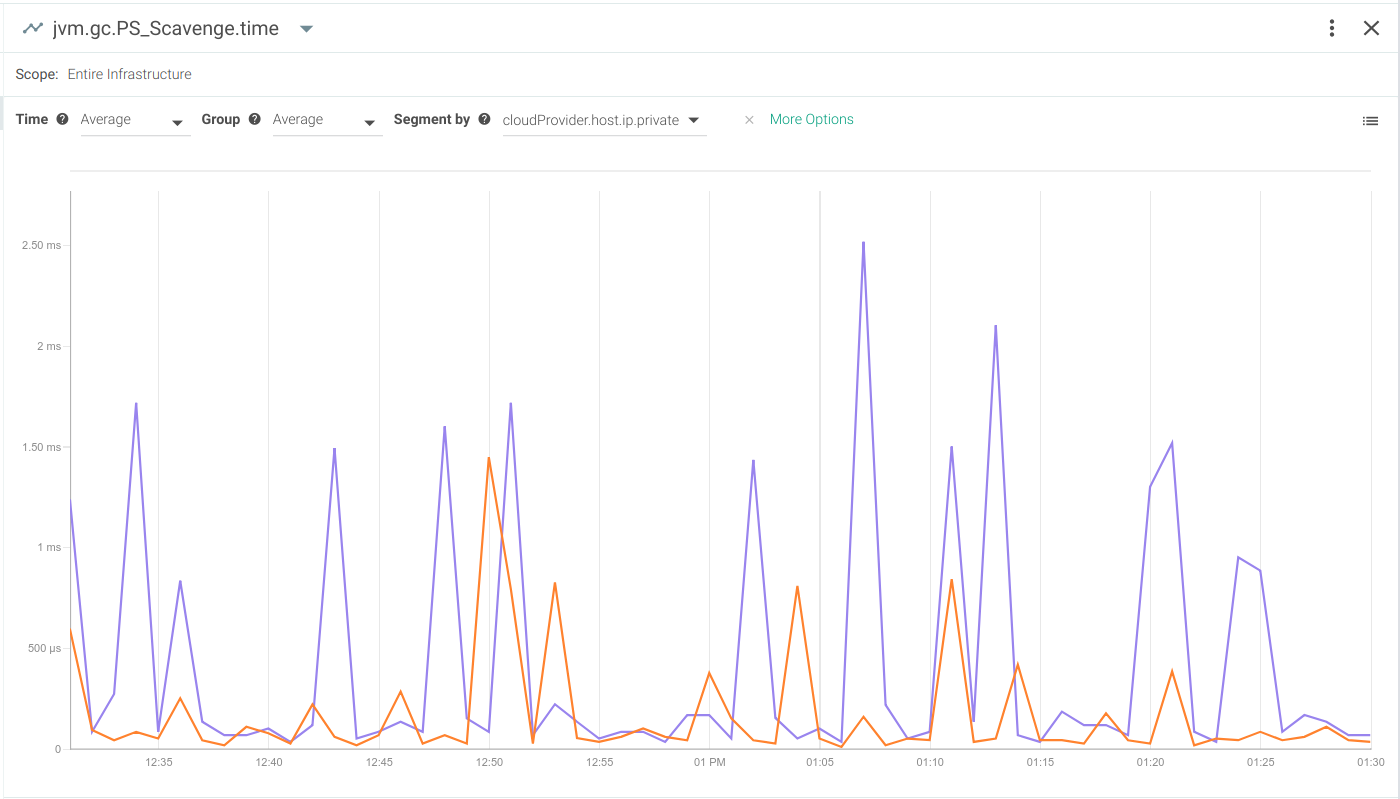
Garbage Collector – LastGcInfo
MBean: java.lang:type=GarbageCollector,name=[your GC name] LastGcInfo is a structure of information about the last garbage collection event performed with the following data:|
GcThreadCount |
Number of threads that performed the GC |
|
duration |
Total duration of the GC event |
|
startTime |
Start time in milliseconds since the JVM was launched |
|
endTime |
End time in milliseconds since the JVM was launched |
|
memoryUsageBeforeGc |
Structure of information about the committed, initial, max and used memory before the event |
|
memoryUsageAfterGc |
Structure of information about the committed, initial, max and used memory after the event |
Arch
MBean: java.lang:type=OperatingSystem Processor architecture.AvailableProcessors
MBean: java.lang:type=OperatingSystem Number of available central processing units.CommittedVirtualMemorySize
MBean: java.lang:type=OperatingSystem This represents the amount of memory -in bytes- that is guaranteed to be available for use by the JVM.FreePhysicalMemorySize
MBean: java.lang:type=OperatingSystem This represents the amount of memory of free physical memory in the host (free = total – (used + shared + cached + buffered)).MaxFileDescriptorCount
MBean: java.lang:type=OperatingSystem This is the number of file descriptors we can have opened in the same process, as determined by the operating system. You can never have more file descriptors than this number.OpenFileDescriptorCount
MBean: java.lang:type=OperatingSystem This is the number of opened file descriptors at the moment, if this reaches the MaxFileDescriptorCount, the application will throw anIOException: Too many open files. This could mean you’re are opening file descriptors and never closing them. You can monitor this variable, and alert if it approaches the MaxFileDescriptorCount value.
FreeSwapSpaceSize
MBean: java.lang:type=OperatingSystem FreeSwapSpaceSize is the amount of swap memory -in bytes- still available in the host.ProcessCpuLoad
MBean: java.lang:type=OperatingSystem ProcessCpuLoad represents the CPU load in this process.ProcessCpuTime
MBean: java.lang:type=OperatingSystem This is the time the CPU has spent running this process.SystemCpuLoad
MBean: java.lang:type=OperatingSystem Represents the current load of CPU in the host system.SystemLoadAverage
MBean: java.lang:type=OperatingSystem Represents the average load in the host system. Matches with the value given by the command:cat /proc/loadavg | awk '{print $1}'
TotalPhysicalMemorySize
MBean: java.lang:type=OperatingSystem Host memory size in bytes.TotalSwapSpaceSize
MBean: java.lang:type=OperatingSystem Host swap memory size in bytes.Version
MBean: java.lang:type=OperatingSystem Host’s kernel version. It matches the value given by:uname -r