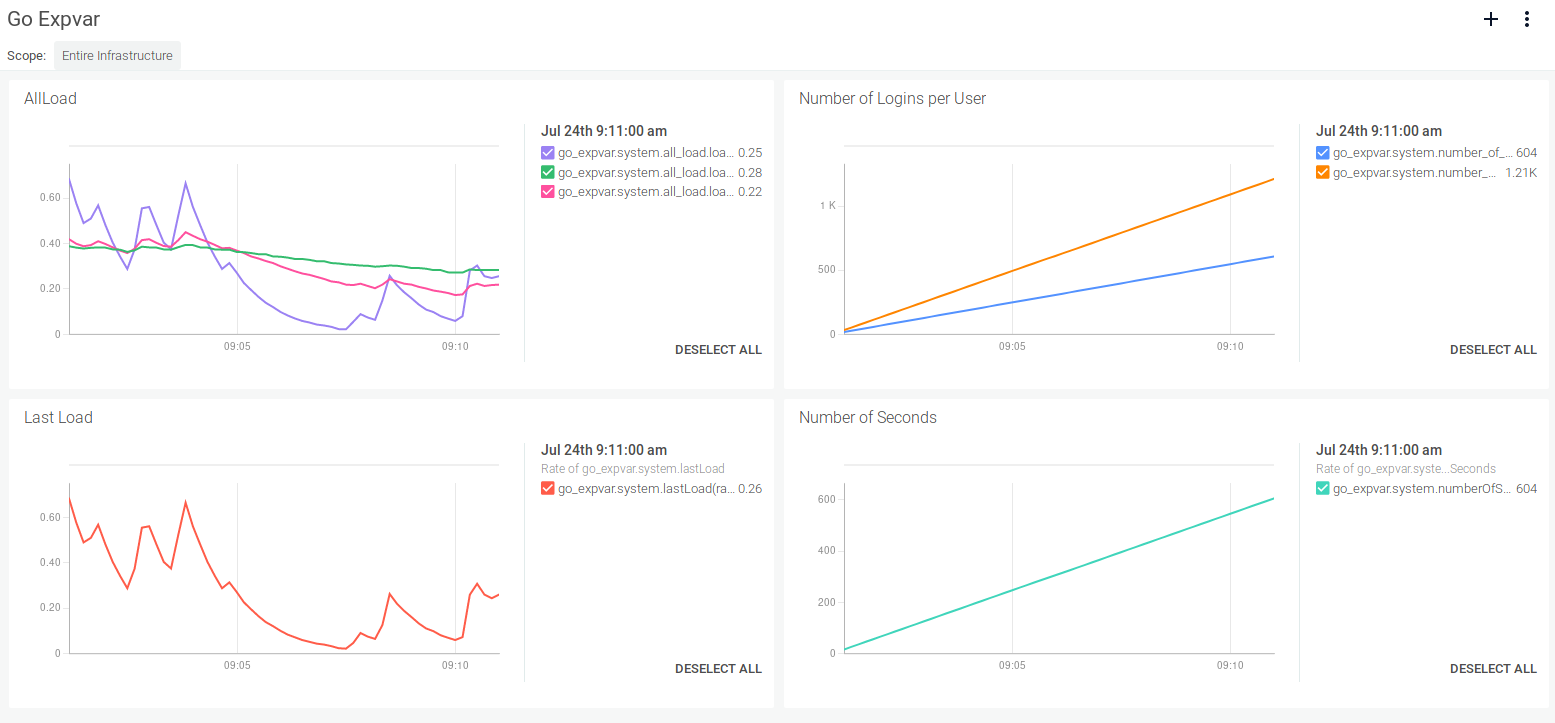
In this tutorial we are going to learn how to instrument Golang code to expose application custom metrics using expvar. This will help you monitor availability, health and performance of your Go application.
Golang expvar is the standard interface designed to instrument and expose custom metrics from a Go program via HTTP. In addition to custom metrics, also exports some metrics out of the box like command line arguments, allocation stats, heap stats, and garbage collection metrics. The name expvars comes from “exp” + “var” = “expvar”. Metrics can be collected by your favourite monitoring tool through an HTTP endpoint /debug/vars that exposes them in JSON format.
What’s more is the power expvar gives developers to expose their own custom variables. These are extremely useful to identify bottlenecks and determine whether the application meets its expected behavior and performance.
How to instrument #Golang code with expvar for #monitoring custom metrics
Click to tweet
Monitoring a Go application: How Golang expvar works
expvar is the native language library if we want to instrument or add metrics to a Golang application. An alternative option is using third-party libraries like Prometheus metrics / Open metrics. That’s a good option if we want a consistent metric format across different languages, but expvar doesn’t require additional dependencies and provides some metrics already out of the box.
When we import the expvar library, the following function will automatically be called:
func init() {

  http.HandleFunc("/debug/vars", expvarHandler)

  Publish("cmdline", Func(cmdline))

  Publish("memstats", Func(memstats))
}
/debug/vars as the endpoint where all the metrics will be published in JSON format.
We also need to call the ListenAndServe function to open the port and start serving incoming HTTP requests:
http.ListenAndServe(":8080", nil)
Types of Golang expvar metrics
There are five types of metrics you can export using Golang’s expvar library. In this section we’ll explore examples of how to create each:expvar String
stringVar = expvar.NewString(“metricName”)expvar Integer
intVar = expvar.NewInt(“metricName”)expvar Float64
floatVar = expvar.NewFloat(“metricName”)expvar Map
mapVar = expvar.NewMap(“metricName”)expvar Structs and functions
To export astruct, we first need to create a function that returns it as an interface{}:. We can export any structure, but must be a return value from a function.
For example, imagine we want to export the following data struct:
type MyStruct struct {

  Field1 float64

  Field2 string

  Field3 int

}
func MyStructData() interface{} {
  return MyStruct {

     Field1: 0.42,

     Field2: "text",

     Field3: 5,

  }
}
expvar.Publish("metricName", expvar.Func(MyStructData))
Example of instrumenting Go code with expvar
Because everyone want’s to see a complete working example, here we’re going to export all five kinds of Go expvar metrics within a small sample application. We’ll export the system load metrics in a data structure, a float with the last load value, an integer with the number of seconds the application has been running, a string with the application name, and a map with some fake values of the number of times different test users logged in into the app.
File: main.go
-------------

package main

import (
  "expvar"
  "net/http"
  "time"
  "os"
  "io/ioutil"
  "strings"
  "strconv"
)

// Publish the port as soon as the program starts
func init() {
  go http.ListenAndServe(":8080", nil)
}

// Custom struct that will be exported
type Load struct {
  Load1  float64
  Load5  float64
  Load15 float64
}

// Function that will be called by expvar
// to export the information from the structure
// every time the endpoint is reached
func AllLoadAvg() interface{} {
  return Load{
     Load1:  loadAvg(0),
     Load5:  loadAvg(1),
     Load15: loadAvg(2),
  }
}

// Aux function to retrieve the load average
// in GNU/Linux systems
func loadAvg(position int) float64 {
  data, err := ioutil.ReadFile("/proc/loadavg")
  if err != nil {
     panic(err)
  }
  values := strings.Fields(string(data))

  load, err := strconv.ParseFloat(values[position], 64)
  if err != nil {
     panic(err)
  }

  return load
}

func main() {

  var (
     numberOfSecondsRunning = expvar.NewInt("system.numberOfSeconds")
     programName            = expvar.NewString("system.programName")
     lastLoad               = expvar.NewFloat("system.lastLoad")
     numberOfLoginsPerUser  = expvar.NewMap("system.numberOfLoginsPerUser")
  )

  // The contents returned by the function will be autoexported in JSON format
  expvar.Publish("system.allLoad", expvar.Func(AllLoadAvg))

  programName.Set(os.Args[0])

  // We will increment this metrics every second
  for {
     numberOfSecondsRunning.Add(1)
     lastLoad.Set(loadAvg(0))
     numberOfLoginsPerUser.Add("foo", 2)
     numberOfLoginsPerUser.Add("bar", 1)
     time.Sleep(1 * time.Second)
  }
}
$ git clone https://github.com/tembleking/custom-metrics.git
$ docker build custom-metrics/go-expvar -t go-expvar
$ docker run -d --rm --name go-expvar -p 8080:8080 go-expvar
Now, you can check out if it exposes the custom metrics we instrumented plus the default Go runtime metrics:
$ curl localhost:8080/debug/vars

{

"cmdline": ["/go-expvar"],

"memstats": {"Alloc":878208,"TotalAlloc":878208,"Sys":3084288,"Lookups":277,"Mallocs":6310,"Frees":155,"HeapAlloc":878208,"HeapSys":1703936,"HeapIdle":90112,"HeapInuse":1613824,"HeapReleased":0,"HeapObjects":6155,"StackInuse":393216,"StackSys":393216,"MSpanInuse":26600,"MSpanSys":32768,"MCacheInuse":13888,"MCacheSys":16384,"BuckHashSys":2671,"GCSys":137216,"OtherSys":798097,"NextGC":4473924,"LastGC":0,"PauseTotalNs":0,"PauseNs":[0,0,0,0,0,0,0,0,0,0,0,0,0,0,0,0,0,0,0,0,0,0,0,0,0,0,0,0,0,0,0,0,0,0,0,0,0,0,0,0,0,0,0,0,0,0,0,0,0,0,0,0,0,0,0,0,0,0,0,0,0,0,0,0,0,0,0,0,0,0,0,0,0,0,0,0,0,0,0,0,0,0,0,0,0,0,0,0,0,0,0,0,0,0,0,0,0,0,0,0,0,0,0,0,0,0,0,0,0,0,0,0,0,0,0,0,0,0,0,0,0,0,0,0,0,0,0,0,0,0,0,0,0,0,0,0,0,0,0,0,0,0,0,0,0,0,0,0,0,0,0,0,0,0,0,0,0,0,0,0,0,0,0,0,0,0,0,0,0,0,0,0,0,0,0,0,0,0,0,0,0,0,0,0,0,0,0,0,0,0,0,0,0,0,0,0,0,0,0,0,0,0,0,0,0,0,0,0,0,0,0,0,0,0,0,0,0,0,0,0,0,0,0,0,0,0,0,0,0,0,0,0,0,0,0,0,0,0,0,0,0,0,0,0,0,0,0,0,0,0,0,0,0,0,0,0],"PauseEnd":[0,0,0,0,0,0,0,0,0,0,0,0,0,0,0,0,0,0,0,0,0,0,0,0,0,0,0,0,0,0,0,0,0,0,0,0,0,0,0,0,0,0,0,0,0,0,0,0,0,0,0,0,0,0,0,0,0,0,0,0,0,0,0,0,0,0,0,0,0,0,0,0,0,0,0,0,0,0,0,0,0,0,0,0,0,0,0,0,0,0,0,0,0,0,0,0,0,0,0,0,0,0,0,0,0,0,0,0,0,0,0,0,0,0,0,0,0,0,0,0,0,0,0,0,0,0,0,0,0,0,0,0,0,0,0,0,0,0,0,0,0,0,0,0,0,0,0,0,0,0,0,0,0,0,0,0,0,0,0,0,0,0,0,0,0,0,0,0,0,0,0,0,0,0,0,0,0,0,0,0,0,0,0,0,0,0,0,0,0,0,0,0,0,0,0,0,0,0,0,0,0,0,0,0,0,0,0,0,0,0,0,0,0,0,0,0,0,0,0,0,0,0,0,0,0,0,0,0,0,0,0,0,0,0,0,0,0,0,0,0,0,0,0,0,0,0,0,0,0,0,0,0,0,0,0,0],"NumGC":0,"NumForcedGC":0,"GCCPUFraction":0,"EnableGC":true,"DebugGC":false,"BySize":[{"Size":0,"Mallocs":0,"Frees":0},{"Size":8,"Mallocs":186,"Frees":0},{"Size":16,"Mallocs":608,"Frees":0},{"Size":32,"Mallocs":4048,"Frees":0},{"Size":48,"Mallocs":155,"Frees":0},{"Size":64,"Mallocs":54,"Frees":0},{"Size":80,"Mallocs":287,"Frees":0},{"Size":96,"Mallocs":17,"Frees":0},{"Size":112,"Mallocs":146,"Frees":0},{"Size":128,"Mallocs":15,"Frees":0},{"Size":144,"Mallocs":6,"Frees":0},{"Size":160,"Mallocs":17,"Frees":0},{"Size":176,"Mallocs":9,"Frees":0},{"Size":192,"Mallocs":2,"Frees":0},{"Size":208,"Mallocs":160,"Frees":0},{"Size":224,"Mallocs":5,"Frees":0},{"Size":240,"Mallocs":0,"Frees":0},{"Size":256,"Mallocs":11,"Frees":0},{"Size":288,"Mallocs":11,"Frees":0},{"Size":320,"Mallocs":2,"Frees":0},{"Size":352,"Mallocs":23,"Frees":0},{"Size":384,"Mallocs":28,"Frees":0},{"Size":416,"Mallocs":9,"Frees":0},{"Size":448,"Mallocs":0,"Frees":0},{"Size":480,"Mallocs":0,"Frees":0},{"Size":512,"Mallocs":132,"Frees":0},{"Size":576,"Mallocs":6,"Frees":0},{"Size":640,"Mallocs":3,"Frees":0},{"Size":704,"Mallocs":2,"Frees":0},{"Size":768,"Mallocs":0,"Frees":0},{"Size":896,"Mallocs":3,"Frees":0},{"Size":1024,"Mallocs":13,"Frees":0},{"Size":1152,"Mallocs":6,"Frees":0},{"Size":1280,"Mallocs":1,"Frees":0},{"Size":1408,"Mallocs":1,"Frees":0},{"Size":1536,"Mallocs":132,"Frees":0},{"Size":1792,"Mallocs":5,"Frees":0},{"Size":2048,"Mallocs":17,"Frees":0},{"Size":2304,"Mallocs":5,"Frees":0},{"Size":2688,"Mallocs":2,"Frees":0},{"Size":3072,"Mallocs":0,"Frees":0},{"Size":3200,"Mallocs":0,"Frees":0},{"Size":3456,"Mallocs":0,"Frees":0},{"Size":4096,"Mallocs":11,"Frees":0},{"Size":4864,"Mallocs":1,"Frees":0},{"Size":5376,"Mallocs":1,"Frees":0},{"Size":6144,"Mallocs":4,"Frees":0},{"Size":6528,"Mallocs":0,"Frees":0},{"Size":6784,"Mallocs":0,"Frees":0},{"Size":6912,"Mallocs":0,"Frees":0},{"Size":8192,"Mallocs":1,"Frees":0},{"Size":9472,"Mallocs":8,"Frees":0},{"Size":9728,"Mallocs":0,"Frees":0},{"Size":10240,"Mallocs":0,"Frees":0},{"Size":10880,"Mallocs":0,"Frees":0},{"Size":12288,"Mallocs":0,"Frees":0},{"Size":13568,"Mallocs":0,"Frees":0},{"Size":14336,"Mallocs":0,"Frees":0},{"Size":16384,"Mallocs":0,"Frees":0},{"Size":18432,"Mallocs":0,"Frees":0},{"Size":19072,"Mallocs":0,"Frees":0}]},

"system.allLoad": {"Load1":1.05,"Load5":1.35,"Load15":1.15},

"system.lastLoad": 0.88,

"system.numberOfLoginsPerUser": {"bar": 129, "foo": 258},

"system.numberOfSeconds": 129,

"system.programName": "/go-expvar"

}
Golang expvar Docker monitoring using Sysdig Monitor
Once you have the metrics you want coming from your app, you need to be able to collect, store, alert and compare them with other system, Docker, Kubernetes metrics to make them useful. So it’s likely you’ll want your monitoring system to collect theseexpvar metrics, which can be complicated once you start running your Golang applications in containers. These are some of the complexities you could run into when collecting expvar metrics:
- You need to expose metrics in an additional port, change your
Dockerfilefor that, and maybe update you Kubernetes Pod definition to have external network access. - Pods are going to be moving around your Kubernetes nodes, how do you know which IP/port is each Go app?
- If you run this in production, you will need some security with authentication and encryption.
- Collect
expvarmetrics in one place, automatically! The Sysdig agent will dynamically enter in the network namespace of your running container and collect theexpvarsfrom the endpoint binded tolocalhost. You don’t need to expose theexpvarsport or modify anyDockerfilesor Kubernetes manifests. With Sysdig Monitor,expvarmetric collection is made damn simple and secure. - You can automatically discover the different components of microservices applications, uncover how they interact with each other, and understand how the application works and is deployed in Kubernetes from a high level—all while being able to identify if any connections between components breaks.
- No further code changes required. Sysdig Monitor will give you all the metrics you need right out of the box, including resource usage metrics per host and container as well as Golden Signal to monitor service health and performance—including connections, response time, and errors.
expvar custom metric collection up and running.
This example shows how to collect both the default expvar metrics and custom metrics from our previous example. In the dragent.yaml or the Kubernetes configMaps that handles it, under the app_checks section, add:
File: config.yaml
-----------------

 - name: go-expvar
    check_module: go_expvar
    pattern:
          comm: go-expvar
    conf:
      expvar_url: "http://localhost:8080/debug/vars" # automatically match url using the listening port
      # Add custom metrics if you want
      metrics:
        - path: system.numberOfSeconds
            type: gauge # gauge or rate
            alias: go_expvar.system.numberOfSeconds
        - path: system.lastLoad
            type: gauge
            alias: go_expvar.system.lastLoad
        - path: system.numberOfLoginsPerUser/.* # You can use / to get inside the map and use .* to match any record inside
            type: gauge
        - path: system.allLoad/.*
            type: gauge
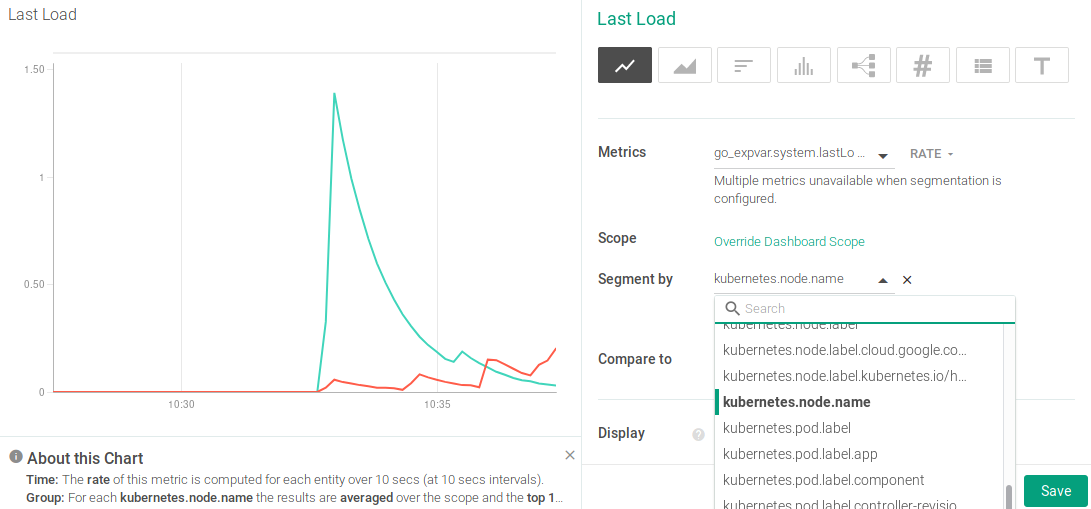
 Sysdig Monitor also tags all
 expvar metrics with any available metadata so you always know from which cloud provider – like AWS, GCP, or Azure, region, cluster, Kubernetes node, container, Kubernetes namespace, deployment, pod, or process (to name a few) the metric is coming.
 Ready to slice and dice your metrics to better understand both your overall service behavior as well as specific container behavior? Reach out or sign-up for a free trial to make instrumenting Go code with custom
 expvar metrics efficient and reliable.

